Visualize Success: Transform Data with Customizable Dashboards, Graphs, and Charts
See Your Farm's Story Unfold
Gain a clear, intuitive understanding of your farm's performance through interactive dashboards, compelling visuals, and insightful charts.
- Create personalized dashboards that display the information most important to you.
- Visualize data through graphs and charts, making complex information easy to understand.
- Drill down into specific data points and explore trends, patterns, and anomalies with visualizations.


Create useful dashboard with simple drag and drop. If you need more help, we can always help you set it up.

Customizable Dashboard Views & Enhanced Visualization
Cultivate-Agri's "View+" feature offers powerful visualization tools, including customizable dashboards, interactive graphs, and charts, empowering you to transform raw data into actionable insights and make informed decisions with clarity.
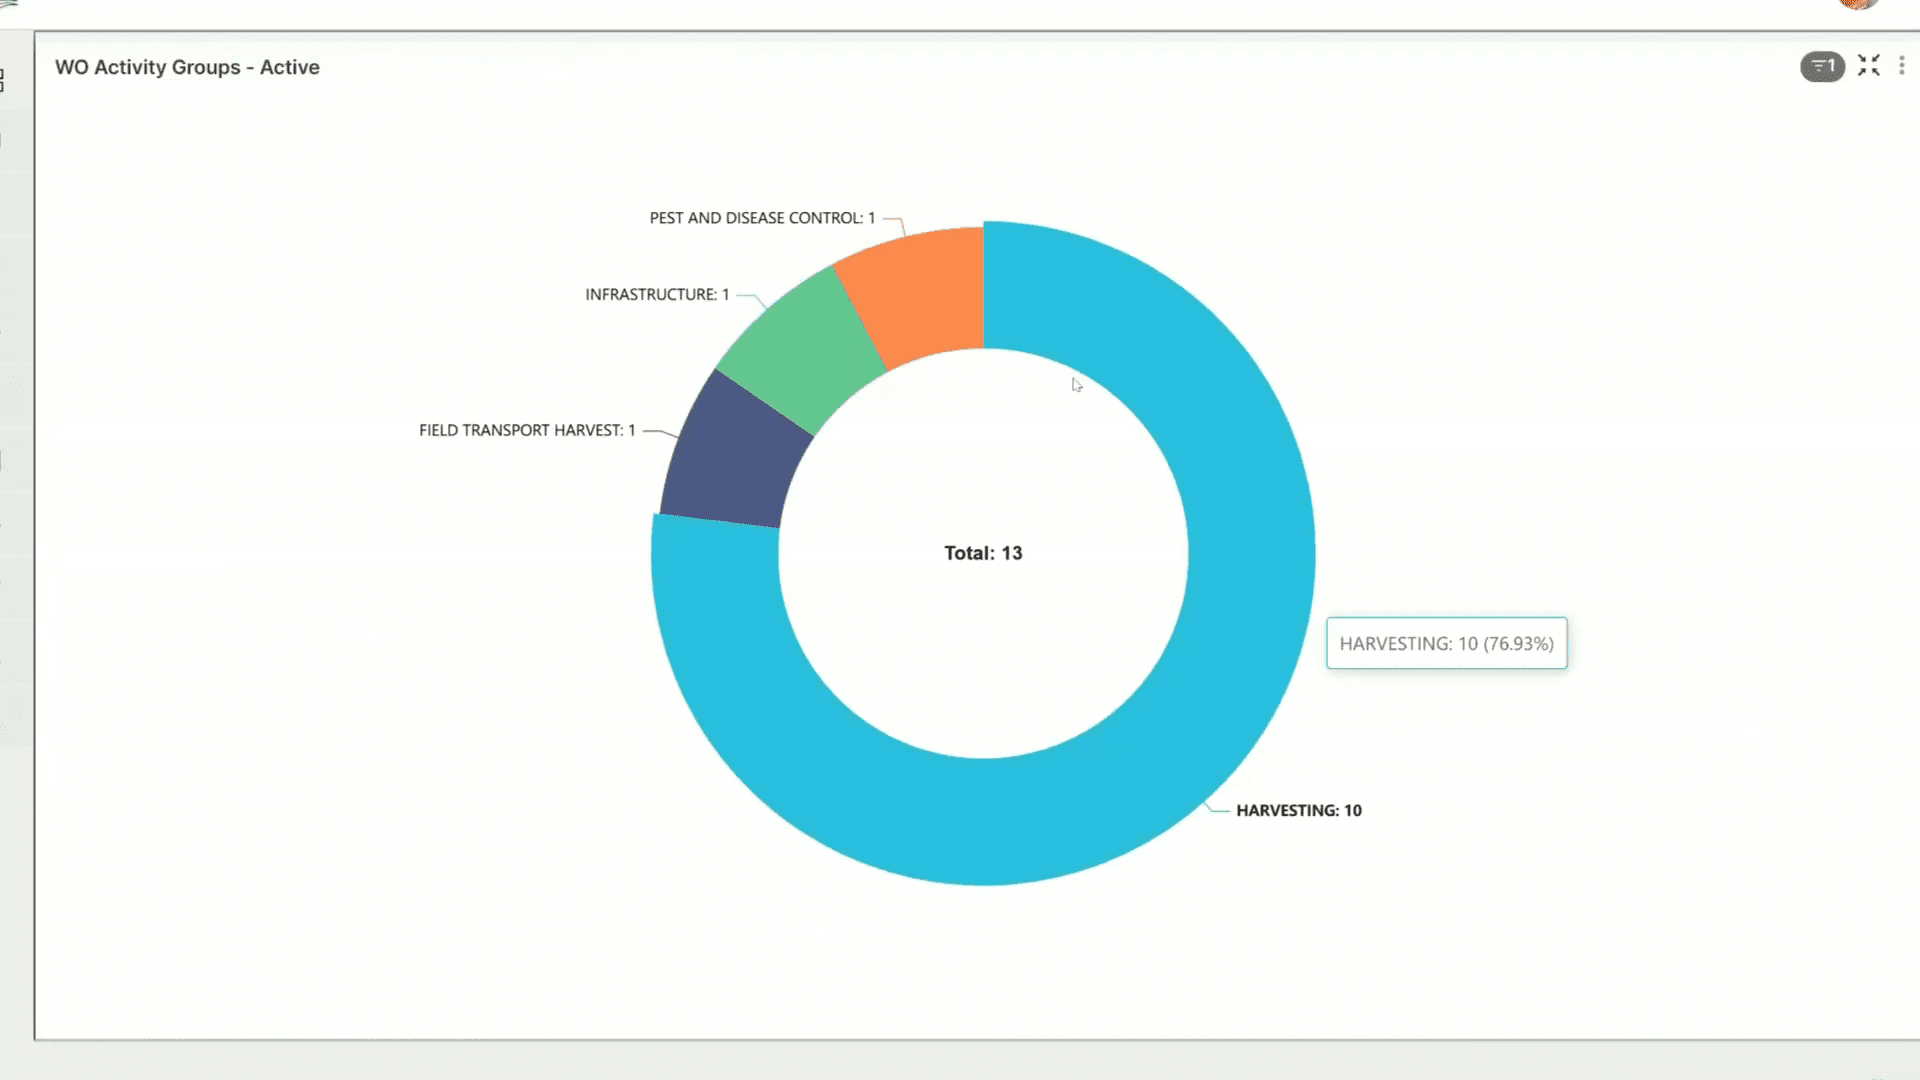
Customizable Dashboards
Design personalized dashboards that display key metrics, KPIs, and other information most relevant to your role and responsibilities.
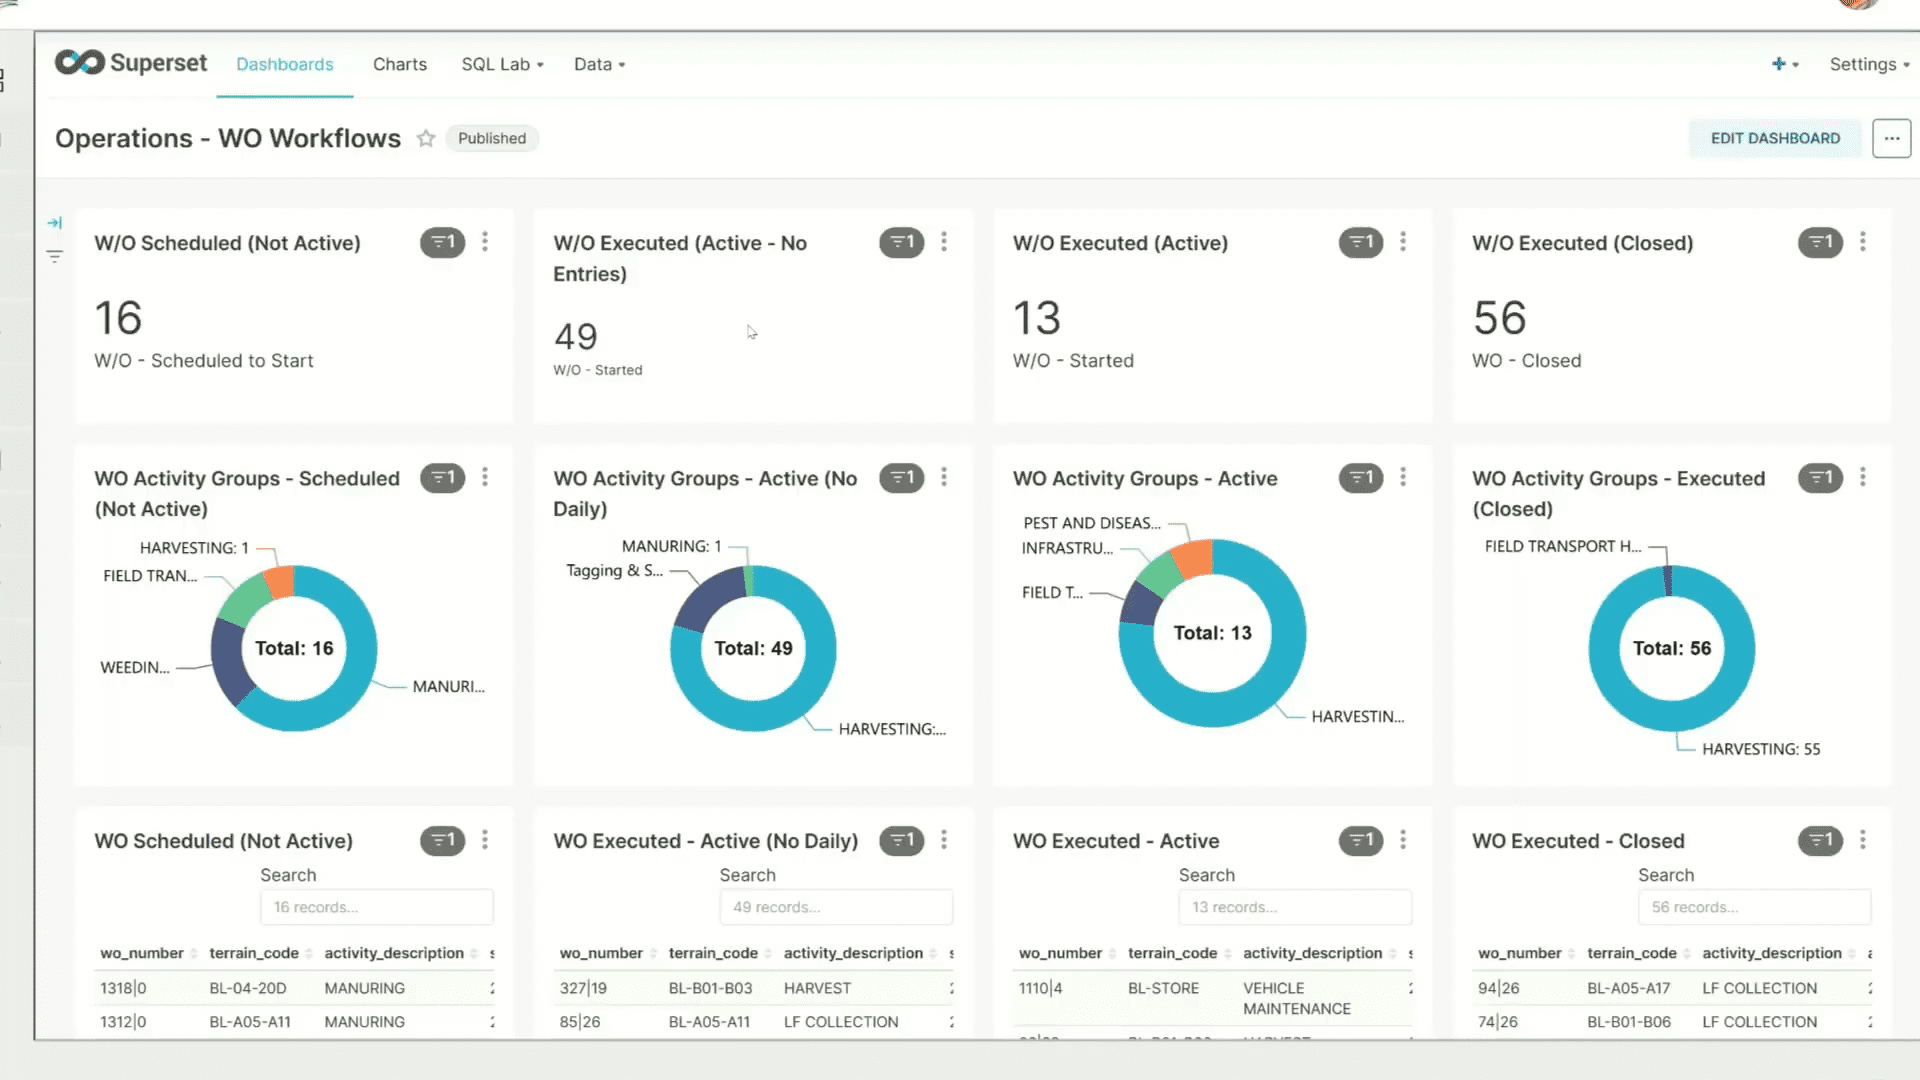
Interactive Graphs and Charts
Visualize data using a variety of chart types, including bar charts, line graphs, pie charts, scatter plots, and more, making complex information easy to interpret.
Data Drill-Down
Explore data in greater detail by drilling down into specific data points, uncovering underlying trends, patterns, and anomalies.
Visual Reporting
Generate visually appealing reports that effectively communicate key insights and performance trends to stakeholders.
Gain a deeper understanding of your farm's performance with dynamic visualizations that illuminate trends, highlight opportunities, and drive data-driven decisions.
Contact us today and experience the benefits of Customizable Dashboard Views and Enhanced Visualization with Graphs and Charts, complete with free training and onboarding support.
Schedule a demoEnhanced Comprehension
Visualize complex data in an easy-to-understand format, improving comprehension and facilitating faster insights.

Improved Communication
Communicate key performance indicators and trends effectively with visually appealing dashboards and reports.
Faster Insights
Quickly identify trends, patterns, and anomalies with interactive visualizations that allow you to drill down into the data.

Data-Driven Decisions
Make more informed decisions based on a clear and intuitive understanding of your farm's performance
What types of charts and graphs are available in Cultivate-Agri?
Cultivate-Agri offers a wide range of chart types, including bar charts, line graphs, pie charts, scatter plots, heatmaps, and more.
Can I customize the colors, labels, and other visual elements of the charts?
Yes, you have full control over the visual appearance of your charts, including colors, labels, legends, and other elements, allowing you to create customized visualizations that meet your needs.
Can I share my dashboards and visualizations with other users?
Yes, you can easily share your dashboards and visualizations with other users within your organization, promoting collaboration and data transparency.
Can I customize the dashboard to display different types of data simultaneously?
Absolutely. Our platform allows you to add multiple widgets and data sources to a single dashboard, enabling you to view various metrics and data types side by side for comprehensive insights.